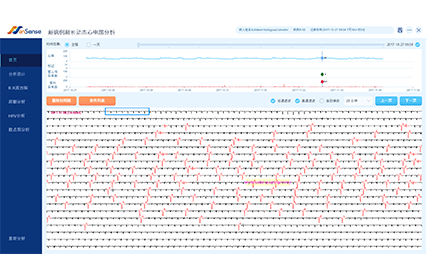
Display in high resolution all the continuous electrocardiosignals stored in ECG recorder as well as the relevant analysis data and charts, including whole-course heart rate tendency chart (each minute, 30 seconds and 1 second), R-R interval histogram, marked event ECG, and so on.
Use man-machine interaction via mouse or keyboard to input parameters and commands for performing dynamic ECG analysis, complete confirmation, revision, editing and other processing, and finally generate diagnosis report.
Detection report includes patient information, recording starting & ending time, actual effective analysis time, total number of heart beats, total number of atrial premature beats, total number of ventricular premature beats, fastest and slowest heart rate and their occurrence time, average heart rate, number of times and proportion of atrial premature beat (single, pair and string), number of times and proportion of ventricular premature beat (single, pair and string), number of times and proportion of bradycardia, longest bradycardia duration and its occurrence time, number of times and proportion of cardiac arrest, longest cardiac arrest duration and its occurrence time, clinical report conclusion, statistics of total hours of analysis result, list of clinical diagnosis of patient marked event, ECG strips, heart rate/abnormal heart beat tendency chart, R-R interval histogram, and etc.